
How to Study a Company’s Past 10-Year Sales Trend
Beginner-friendly stock research framework with checklists, comparison tables, FAQs, useful resources, affiliate tools, and references.

Stock investing becomes less intimidating when every decision follows a visible path. The beginner’s problem is rarely lack of information; it is too much information without order. News, charts, ratios, influencer opinions, quarterly results, and analyst targets all compete for attention. This post gives you a clean decision structure for how to study a company’s past 10-year sales trend so that your research becomes calmer and more consistent.
Use this article as a practical checklist. You can copy the tables into a spreadsheet, adapt the questions to your own investing style, and reuse the framework whenever you review a new company. The examples are deliberately general because the method should work across sectors such as banking, technology, FMCG, pharma, auto, capital goods, energy, consumer products, and digital businesses.
Why This Topic Matters
This guide shows How to Study a Company’s Past 10-Year Sales Trend with a practical process that a beginner can repeat before placing money into an individual stock. Many new investors enter the stock market with energy but without a repeatable process. They read tips, watch price movement, compare returns, and then feel confused when a stock behaves differently from their expectations. A structured approach protects beginners from the most expensive mistake: buying first and understanding later.
The purpose of this Sensecentral guide is to make how to study a company’s past 10-year sales trend practical. The goal is not to predict tomorrow’s price. The goal is to understand whether a company has a business worth studying, whether the financials support the story, whether the valuation is reasonable, and whether the risk fits your personal plan.
This topic is especially important because individual stocks carry company-specific risk. A diversified fund spreads risk across many companies, but one stock can fall sharply because of governance issues, weak demand, debt stress, regulatory action, competition, or a valuation reset. That is why every stock idea needs a checklist, not just excitement.
Think of stock research as a filter. You do not need to buy every good company. You need to patiently reject unclear ideas, wait for reasonable prices, and build knowledge one company at a time. When you treat research as a filter, missed opportunities become less painful because your priority is avoiding permanent mistakes.
Educational note: This article is for learning and research only. It is not personal financial advice, stock recommendation, tax advice, or a guarantee of returns. Always consider your risk profile and consult a qualified advisor before making investment decisions.
The Practical Beginner Framework
A beginner stock framework should be simple enough to repeat and strict enough to prevent random decisions. Use a three-layer approach: business quality, financial quality, and valuation discipline. Business quality answers whether the company deserves attention. Financial quality answers whether the numbers support the story. Valuation discipline answers whether the current price already assumes too much success.
Step 1: Understand the business before the stock
Begin with the company, not the chart. What does it sell? Who buys from it? Is demand repeatable? Are customers price-sensitive? Does the company have a brand, cost advantage, distribution advantage, technology edge, regulatory advantage, or network effect? If you cannot explain the business model clearly, postpone the purchase.
Step 2: Connect the topic to numbers
For this post, the main focus is long-term financial history, trend analysis, stability, and how past numbers reveal the character of a business. Turn that focus into measurable checks. Look at sales growth, profit growth, margins, debt, return on equity, free cash flow, dividend history, and share dilution. Numbers do not remove uncertainty, but they stop a beginner from depending only on stories.
Step 3: Compare price with evidence
The stock market rewards future cash flows, not past excitement. A company can be excellent and still be a poor investment if the price assumes unrealistic growth. A weak company can look cheap and still destroy capital if earnings fall further. Good investing requires asking, “What growth is the current price already expecting?”
Step 4: Write a decision note
Before buying, write a short note with four lines: why the business is attractive, why the numbers are acceptable, why the valuation is reasonable, and what would prove the thesis wrong. This simple habit filters emotional decisions and makes review easier after quarterly results.
| Checkpoint | What to look for | Simple pass/fail test |
|---|---|---|
| Business model | Products, customers, pricing power, repeat demand, and competitive advantage. | Can you explain how the company earns money in two sentences? |
| Financial quality | Revenue trend, profit trend, debt trend, margins, cash flow, and return on equity. | Are the numbers improving for business reasons, not only accounting or one-time events? |
| Valuation | P/E, PEG, P/B, EV/EBITDA, dividend yield, free cash flow yield, and peer comparison. | Does the price leave room for execution risk, slower growth, or market disappointment? |
| Risk control | Position size, diversification, sector exposure, and exit conditions. | Would a 30% fall hurt your plan emotionally or financially? |
| Review rhythm | Quarterly results, annual report, management commentary, and competitor performance. | Do you know what would make you add, hold, reduce, or exit? |
| Question | Beginner mistake | Better stock investing habit |
|---|---|---|
| What am I really checking? | Looking only at the share price or a one-day move. | Connect the price to long-term financial history, trend analysis, stability, and how past numbers reveal the character of a business and the company’s ability to compound value. |
| What time period matters? | Reacting to one headline, one chart candle, or one social media opinion. | Study at least three to ten years of sales, profit, debt, cash flow, and capital allocation patterns. |
| What can go wrong? | Assuming a popular company is automatically a safe stock. | Write down risks such as leverage, margin pressure, cyclicality, competition, governance, and valuation. |
| When should I wait? | Buying immediately because of fear of missing out. | Wait when the business is unclear, valuation is stretched, or the investment reason cannot be written in simple words. |
Example Workflow: How a Beginner Can Apply This
Imagine you find a company after reading about a fast-growing sector. Instead of buying immediately, open a spreadsheet or notebook and create six columns: business model, demand driver, financial trend, valuation, risks, and decision. This turns the stock idea into a research project.
- Business model: Write what the company sells and why customers choose it.
- Demand driver: Note whether demand comes from long-term structural growth, temporary shortage, price increase, government policy, export cycle, or one-time event.
- Financial trend: Check sales, profit, margin, debt, and cash flow over multiple years.
- Valuation: Compare current valuation with the company’s history, peers, and growth rate.
- Risk: Write the top five ways your thesis can fail.
- Decision: Choose one of four actions: reject, watchlist, small starter position, or wait for better price.
This workflow is intentionally slow. Slow research is an advantage for beginners because it reduces impulse buying. A stock that cannot survive a few days of research probably does not deserve your money. If the opportunity is real, you will usually find multiple chances to build a position patiently.
Also remember that not buying is a valid decision. The market has thousands of listed companies. Your job is not to act on every idea. Your job is to protect capital, learn continuously, and buy only when the business, numbers, valuation, and personal risk plan line up.
Common Mistakes to Avoid
Buying because the price has already moved
Price movement attracts attention, but attention is not analysis. A stock can rise because the business is improving, because liquidity is strong, because a sector is fashionable, or because short-term traders are active. Before buying, separate the business reason from the price reason. If the only reason is that the stock has already moved, the decision is closer to speculation than investing.
Ignoring debt and cash flow
Profit can look strong while cash flow is weak. Revenue can rise while receivables also rise. Debt can look manageable until interest rates, currency movement, or a bad cycle expose weakness. Beginners should not study only the income statement. They should also check the balance sheet, cash flow statement, debt maturity, and working capital movement.
Using one ratio as a final answer
A low P/E may reflect low growth or hidden risk. A high ROE may be boosted by debt. A low debt-to-equity ratio may still hide lease obligations or off-balance-sheet risks. A high PEG ratio may be reasonable for a rare quality business, while a low PEG ratio may be a value trap. Ratios are questions to investigate, not verdicts to obey.
Forgetting position size
Even good research can be wrong. A beginner should treat position size as part of research. Small positions allow learning without emotional pressure. Large positions require stronger conviction, deeper research, and a clear plan for what happens if the market disagrees for months or years.
Financial Quality Deep Dive
Financial quality is the bridge between a business story and investment evidence. Revenue growth should be supported by volume growth, customer growth, pricing power, or market share gains. Profit growth should be supported by operating leverage, better product mix, cost efficiency, or durable margin improvement. Debt should remain manageable across cycles, not only during good years.
For beginners, the cash flow statement is especially useful. If reported profit rises but operating cash flow stays weak for years, investigate working capital, receivables, inventory, and capital expenditure. A company that converts profit into cash has more flexibility to reinvest, reduce debt, pay dividends, or survive downturns.
Dividend history can also reveal discipline, but dividends should not be judged in isolation. A company that pays dividends while borrowing heavily may not be stronger than a company that reinvests cash at high returns. Always connect dividends with cash flow, reinvestment needs, debt, and growth runway.
Useful Resources for Investors and Creators
Stock research improves when you use good tools, clean templates, and reliable learning resources. The following resources are included for readers who also build websites, sell digital products, teach online, or create content around finance and business topics.
Useful Resource: Explore Our Powerful Digital Products
Browse these high-value bundles for website creators, developers, designers, startups, content creators, and digital product sellers. If you build websites, publish content, sell digital products, or manage online business assets, these resources can save planning and production time.
Productivity Tools Hub: Zee Sharp
Zee Sharp is a growing suite of free online tools for productivity, development, and creativity. No sign-up. No watermarks. Just tools. It can be useful when you need quick calculators, formatters, writing helpers, or creator utilities while researching and publishing online.
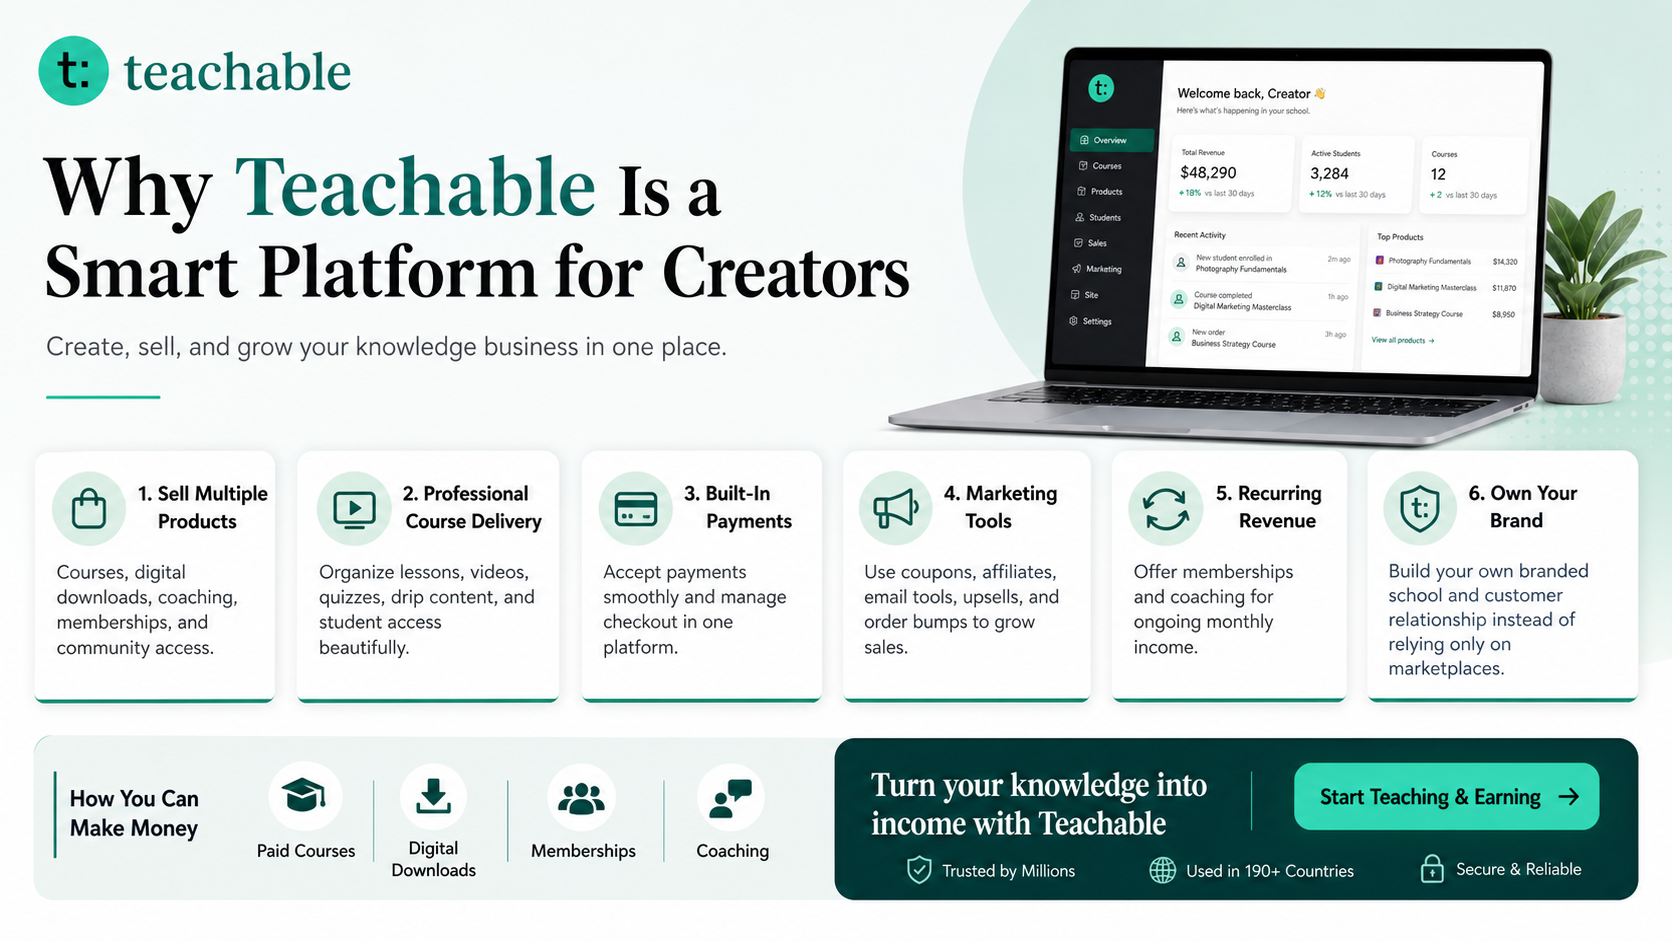
Creator Business Tool: Teachable
Teachable is an online platform that lets creators build, market, and sell courses, digital downloads, coaching, and memberships. It helps educators and entrepreneurs turn their knowledge into a branded digital business without needing complex coding.
Learn more on Sensecentral: How to Make Money with Teachable: A Complete Creator’s Guide
Watch: How to Create a Course With Teachable
FAQs
Is how to study a company’s past 10-year sales trend enough to pick a stock?
No. It is only one part of research. A good stock decision should combine business quality, financial strength, valuation, risk control, management behavior, and your own time horizon. Beginners should avoid turning any one metric, headline, or analyst opinion into a complete buy decision.
How much historical data should a beginner study?
For individual stocks, three years can show recent direction, but ten years reveals much more about cycles, debt behavior, capital allocation, margin pressure, and resilience. When ten-year data is not available, reduce position size and demand a larger margin of safety.
Should beginners buy individual stocks or start with diversified funds?
Many beginners are better served by learning with small position sizes while keeping the core portfolio diversified through index funds, ETFs, or mutual funds. Individual stocks require time, temperament, and regular review. A beginner can learn stock analysis without putting a large amount into the first few ideas.
How do I avoid emotional decisions?
Write a one-page stock note before buying. Include the business reason, valuation range, major risks, expected holding period, and what would make you sell. When markets move sharply, compare the news against that note instead of reacting to price alone.
How often should I review a stock after buying?
A practical rhythm is to review quarterly results briefly, annual reports deeply, and valuation whenever the stock price moves far ahead of business progress. Avoid checking prices every hour unless you are trading, because long-term investing is based on business performance, not constant price watching.
Key Takeaways
- How to Study a Company’s Past 10-Year Sales Trend should be used as a structured research habit, not as a shortcut for fast buying.
- Strong stocks usually combine durable demand, clean financials, capable management, and reasonable valuation.
- Cheap valuation can be a trap when earnings are unstable, debt is high, cash flow is weak, or the sector is declining.
- Expensive-looking stocks can still be attractive when growth, quality, and runway are exceptional, but only if expectations are realistic.
- Always write down the investment reason, risk factors, review triggers, and expected holding period before buying.
Further Reading and References
Internal links from Sensecentral
- How to Avoid Companies With Unstable Earnings
- How to Study a Company’s Past 10-Year Profit Trend
- How to Compare Valuation With Growth Rate
- How to Compare a Company With Its Peer Group
- Sensecentral homepage
- How to Make Money with Teachable: A Complete Creator’s Guide


