Uncertainty is defined as a situation where there is a possibility of differing outcomes. For example, in an uncertain situation, the managers should evaluate the chance of difference in expected cash flows. They have to estimate whether the NV would be negative or the IRR would be less than the cost of capital.
Statistical Techniques for Risk Analysis
The following are the major statistical techniques used in risk analysis
Probability Analysis
Probability analysis is primarily defined as the possibility of occurrence of an event. Probability is quantified as a number between 0 and 1 (where 0 indicates impossibility and 1 indicates certainty).
Expected Net Present Value
Expected net present value can be found by multiplying the monetary values of the possible events by their probabilities. Following equation describes the expected net present value −

Where, ENPV is the expected net present value. ENCFt is the expected net cash flows in period t and k is the discount rate.
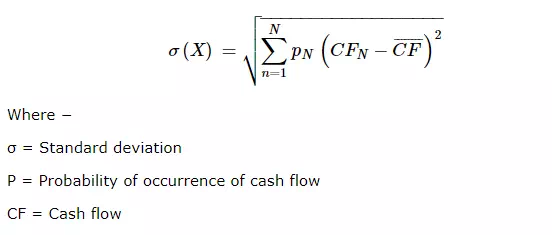
Standard Deviation
Standard deviation is a statistical measure of the amount by which a set of values differs from the arithmetical mean, equal to the square root of the mean of the differences’ squares. For example, a quantity expressing by how much the members of a group differ from the mean value for the group.
Risk analysis of capital budgeting decision is possible by calculating standard deviation and coefficient of variation. An important measure of risk analysis is standard deviation (σ) and it can be used when projects under consideration have same cash outlay. Statically, standard deviation is the square root of variance and variance measures the deviation of the expected cash flow. The formula for calculating standard deviation will be as follows
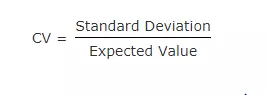
Coefficient of Variation
Coefficient of variation involves the projects which are needed to be compared and involves different outlays. Following is the formula to calculate the coefficient of variation −
Normal Probability Distribution
Risk in investment decision can be further analyzed by normal probability distribution. It helps the decision maker to have an idea of the probability of different expected values of NPV. For example, if the probability of having NPV zero or less is low, it means the risk in the project is negligible. Thus normal probability distribution is an important statistical technique for evaluating the risk in the business.