A common way of analyzing the motion of objects in physics labs is to perform a ticker tape analysis. A longtape is attached to a moving object and threaded through a device that places a tick upon the tape at regular intervals of time – say every 0.10 second. As the object moves, it drags the tape through the “ticker,” thus leaving a trail of dots. The trail of dots provides a history of the object’s motion and therefore a representation of the object’s motion.

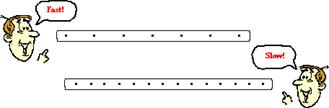
The distance between dots on a ticker tape represents the object’s position change during that time interval. A large distance between dots indicates that the object was moving fast during that time interval. A small distance between dots means the object was moving slow during that time interval. Ticker tapes for a fast- and slow-moving object are depicted below.
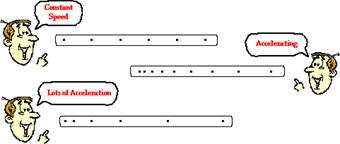
The analysis of a ticker tape diagram will also reveal if the object is moving with a constant velocity or accelerating. A changing distance between dots indicates a changing velocity and thus an acceleration. A constant distance between dots represents a constant velocity and therefore no acceleration. Ticker tapes for objects moving with a constant velocity and with an accelerated motion are shown below.
And so ticker tape diagrams provide one more means of representing various features of the motion of objects.